
RAPI (Remote API) dlls are loaded by rapiclnt.exe on the Windows Mobile device when CeRapiInvoke API is called by the desktop application. CeRapiInvoke is a general-purpose API to remotely execute a function on a Windows Mobile device that is connected to the desktop over ActiveSync.
To debug your RAPI dll, do the following.
1. Launch Visual Studio and Open the RAPI dll project (.sln, .vcproj) in debug mode.
2. Go to Debug Menu and click on Attach to process the menu item.
3. On the transport screen (see below), change the transport selection to Smart Device.
rapiclnt.exe running on the device
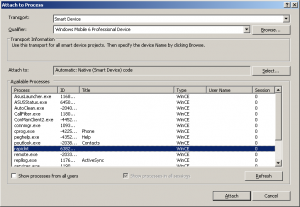
4. On the above screen, select rapiclnt.exe and click on the Attach button. This step makes rapiclnt.exe and all modules loaded by it debuggable as long as debugging information is available to the debugger.
5. Now locate the function that you want to debug in source files and insert the breakpoint (or use DebugBreak function) at an appropriate location. You will see the inactive breakpoint icon. It means this module is not currently loaded. That’s okay as we know we have not yet called the function from the desktop application. When the function is eventually called, it will result in the loading of the RAPI dll by rapiclnt.exe.
6. Now start the desktop side application. As CeRapiInvoke API is called, breakpoints will become active and you will see the control breaking at the first breakpoint.
From here onwards you can just debug the dll as you would debug normal applications.
Note: If you want to debug both a desktop application and RAPI dll, you should open the two projects in separate instances of Visual Studio IDE.
For more details on our products, click here
If you need further assistance, please submit a ticket here